I have a fairly active imagination.
There are times when I can lose myself in mental adventures. My wife would say it happens most when she’s trying to talk to me about something important.
But there is something that I wish my brain was better at. Graphing my blood sugar. I think that in terms of blood sugars, a graph is very powerful. You can see what’s happening (or has happened). You can usually get a pretty good picture of where things are going, and whether you need to do something about it.
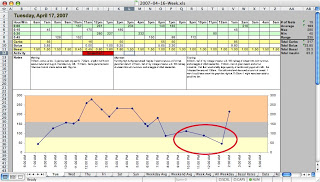
Many of us are using Kevin’s awesome excel spreadsheet. I love it, and use it all the time. I would be lost without it. In fact, if I could have done in my head what Kevin’s logbook does for me on the computer, I could have avoided this particular low and subsequent kitchen destruction. Let’s take a look:
Overall, a pretty wild day. I have had to make a few changes to my basketball routine, and as you can see here that it hit me pretty hard. Took me until much later in the day to get back down to normal.
Do you see what happened that night?
9:45 pm – 112 mg/dl
11:30 pm – 90 mg/dl
A slow and gradual drop. No single number was cause for alarm, or even alert. I felt fine. Then at 1:15 am – 46 mg/dl. Ouch. Awaken from my slumber, ravenous, shaky, ready to eat whatever I can get my hands on. And I do. A bunch of cereal. A bunch. Which, of course I paid for shortly after with a 216 mg/dl, and the next morning with a 268 mg/dl – even though I tried to bolus for an unknown number of carbs I ate.
As I looked at this graph the next day, I really wished I had been able to see that graph last night when I tested at 11:30 pm, I might have paid more attention to the downward trend of the graph, especially so close to the bottom of the target range. I might have had a little snack to fend off that sneaky low that hit a couple hours later.
But, instead, I just went on to sleep feeling pretty good after seeing such a nice number on my meter.
If I would have known, I could have acted.
Likewise, I would have been on the alert if the numbers had been a little more different. For example, dropping from 190 mg/dl to 90 mg/dl (100 points) in two hours is much, much different than dropping from 112 mg/dl to 90 mg/dl (22 points) in two hours.
It’s the slow and sneaky ones that catch us.
I think that things like this will get easier as new CGMS devices are made more affordable, reliable, accessible, and comfortable.
But for now, I’ll just have to practice making charts in my head.


